True Shooting Percentage Calculator
True shooting percentage (TS%) is an advanced basketball metric that measures a player's scoring efficiency by combining two-point field goals, three-pointers, and free throws into a single number. It reveals exactly how many points a player produces per shooting attempt. Analysts and coaches use this number because it provides a much more accurate picture of a player's offensive impact than standard field goal percentage.
Total points scored (2-pointers + 3-pointers + free throws)
Total shot attempts (both 2-point and 3-point attempts)
Total free throw attempts (0 if no free throws taken)
Example: NBA Season Stats
PTS: 1851 | FGA: 1205 | FTA: 665
Result: 61.8% TS% (Excellent efficiency)
Ready to Calculate
Enter points scored, field goal attempts, and free throw attempts to calculate true shooting percentage instantly
League Average: 57.0% TS% | Why TS% matters: It's the most comprehensive shooting efficiency metric, accounting for all scoring methods with appropriate weighting.

Created by Jordan Clarke
Last updated: September 17, 2026
What is True Shooting Percentage?
Standard field goal percentage lies to you. It treats a tough step-back three-pointer exactly the same as a wide-open layup. It also completely ignores free throws. True shooting percentage fixes that problem.
TS% assigns proper mathematical weight to every type of shot a player takes. If a point guard relies heavily on three-pointers and getting to the foul line, their traditional shooting percentages might look perfectly average. But their actual scoring output per possession might be elite. This metric captures the full reality of their scoring ability.
You will see front offices rely on this number heavily during contract negotiations. A player who scores 20 points on 15 shots is significantly more valuable than a player who needs 22 shots to score those same 20 points. True shooting percentage exposes the stark difference between volume scorers and efficient scorers.
How to Calculate True Shooting Percentage
You only need three basic box score stats to find a player's true shooting percentage. You need total points scored (PTS), field goal attempts (FGA), and free throw attempts (FTA).
The True Shooting Percentage Formula
The math behind the metric is surprisingly straightforward once you plug in the numbers.
TS% = Points / (2 * (FGA + 0.44 * FTA))
Once you calculate that number, you multiply the result by 100 to get a clean percentage. The denominator of this formula calculates something called "True Shooting Attempts." This represents the estimated total number of possessions a player used to try and score.
Why Do We Use the 0.44 Multiplier?
This is the most confusing part of the formula for most fans. Why multiply free throw attempts by 0.44 instead of 0.50?
Every trip to the free throw line doesn't consume a full scoring possession. If a player gets fouled shooting a two-pointer, they take two free throws. That makes sense as one complete possession. But players also shoot free throws for technical fouls, defensive three-second violations, and "and-one" situations where the original basket still counts. They also shoot three free throws when fouled behind the arc.
Statisticians looked at decades of basketball data to solve this puzzle. They found that roughly 44 percent of all free throw attempts take up a true shooting possession. The 0.44 coefficient perfectly adjusts for those weird edge cases like technical fouls and four-point plays. Without this adjustment, players who constantly finish through contact for "and-ones" would actually see their efficiency numbers drop.
Real-World Example: Calculating TS% Step-by-Step
Let's put the math into practice with a hypothetical game scenario.
Imagine a starting shooting guard finishes a game with 28 points. Looking at the box score, you see they took 18 field goal attempts and 8 free throw attempts.
First, we need to calculate the True Shooting Attempts (TSA). We multiply the 8 free throw attempts by the 0.44 multiplier. That gives us 3.52. We add that 3.52 to the 18 field goal attempts. Our total TSA is 21.52.
Now we can finish the formula. We multiply our TSA by 2, which gives us 43.04. Finally, we divide the 28 total points by 43.04. The result is 0.6505.
When we multiply by 100, we see this player posted a 65.1% true shooting percentage. That is an incredibly efficient performance.
Player A vs. Player B Comparison
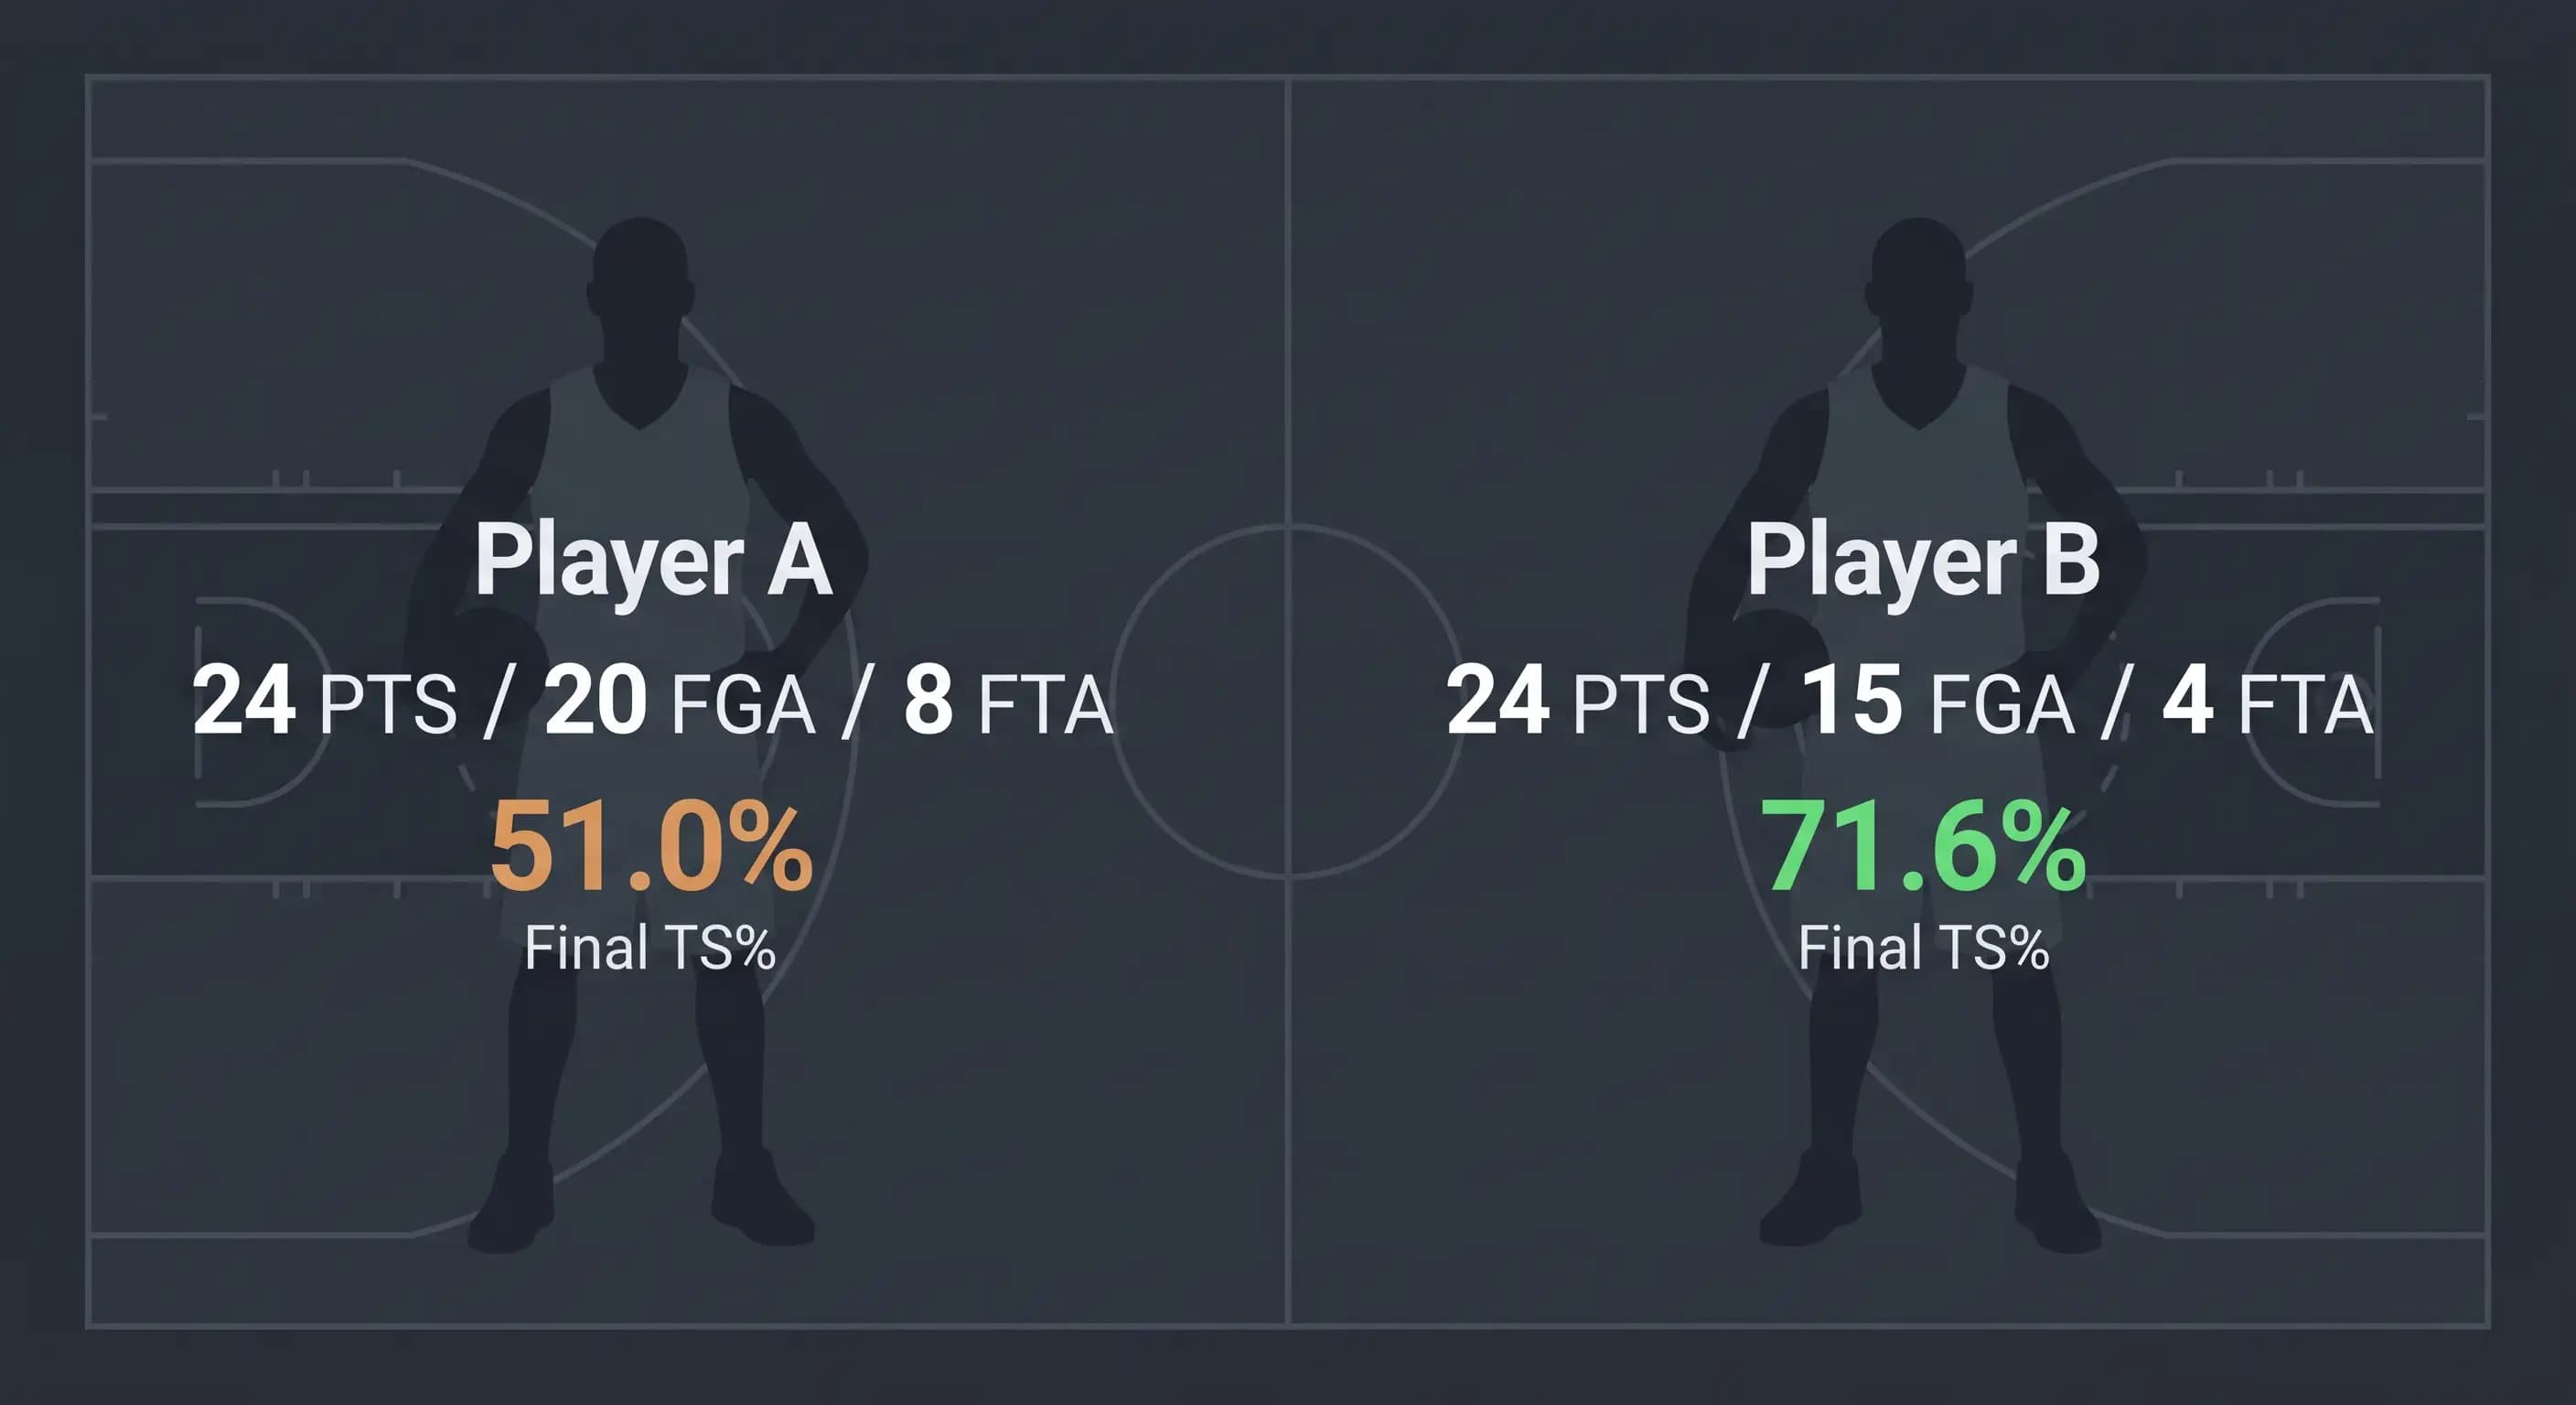
Sometimes the best way to understand this metric is a direct comparison between two different playing styles.
Player A is a traditional big man who scores mostly in the paint. In one game, he scores 24 points on 10 for 20 shooting from the floor. He goes 4 for 8 from the free throw line. He took zero three-pointers.
Player B is a perimeter specialist. He also scores 24 points, but he shoots 7 for 15 from the floor. Six of those made shots were three-pointers. He goes 4 for 4 from the foul line.
Both players scored exactly 24 points. If we only look at traditional field goal percentage, Player A looks better. He shot 50 percent from the floor. Player B only shot 46.6 percent.
But let's run the true shooting numbers.
Player A's TS%: 24 / (2 * (20 + (0.44 * 8))) = 51.0%
Player B's TS%: 24 / (2 * (15 + (0.44 * 4))) = 71.6%
Player B was vastly more efficient. He generated the exact same number of points while using fewer total team possessions to do it. You can see how a standard eFG% calculation alone might miss the free throw impact, but TS% captures the whole picture perfectly.
What is a Good True Shooting Percentage?
League averages shift slightly from year to year based on rule changes and offensive trends. Over the last few NBA seasons, the average true shooting percentage across professional basketball usually sits between 56% and 58%.
The Efficiency Rating Scale
If you want to evaluate a specific performance or an entire season, you can use this general scale.
65% and Above (Elite): This represents the most efficient scorers in the sport. Players hitting this mark are usually MVP candidates, highly accurate three-point specialists, or dominant big men who only take high-percentage dunks.
60% to 64% (Excellent): This is All-Star caliber efficiency. Players in this range score at a high volume without hurting their team's overall offense.
56% to 59% (Average): This is the baseline you expect from a starting-caliber player in today's game.
52% to 55% (Below Average): Players in this range might be young prospects still learning shot selection or aging veterans losing their touch.
Below 51% (Poor): A player shooting below this mark is actively hurting their team's offensive rating when they shoot the ball.
True Shooting Percentage (TS%) vs. Effective Field Goal Percentage (eFG%)
Basketball fans often confuse true shooting percentage with effective field goal percentage. Both metrics try to solve the same problem. They both want to measure scoring efficiency more accurately than basic field goal percentage.
Effective field goal percentage adjusts for the fact that a three-point shot is worth 50 percent more than a two-point shot. It gives shooters proper credit for their range. However, eFG% completely ignores free throws. It only measures shots taken while the game clock is running.
True shooting percentage takes everything into account. It measures field goals, three-pointers, and trips to the foul line all together.
Which Metric Should You Use?
You should use true shooting percentage when you want to evaluate a player's total offensive impact. Drawing fouls is a massive part of winning basketball games. Players who constantly get to the line and hit their free throws add enormous value to an offense. TS% rewards them for that exact skill.
You should use effective field goal percentage when you specifically want to evaluate a player's actual shooting stroke from the floor. If you are a coach analyzing a player's catch-and-shoot mechanics during live play, eFG% cuts out the free throw noise and shows you pure floor spacing value.
Why Coaches and Analysts Rely on True Shooting Percentage
Advanced metrics completely changed the way front offices evaluate talent. The rise of true shooting percentage directly correlates with the explosion of three-point shooting in modern basketball.
Player Evaluation and Contract Value
General managers use this number to find hidden value in the free agent market. A bench player with a low traditional shooting percentage might look unappealing to the casual fan. But if that same player draws fouls at an elite rate and shoots well from the line, their TS% will reveal a highly efficient offensive weapon. Teams pay a premium for players who can score 15 points on a low number of total shot attempts. You can plug these numbers into a player stats tracker to see how efficiency translates directly to higher salaries and more minutes on the court.
Adjusting Game Strategy
Coaches track these numbers constantly to optimize their offensive play calling. If a coach knows a specific bench lineup has a low collective TS%, they will adjust the scheme. They might run more pick-and-roll action to generate easy layups rather than relying on isolation plays. The metric tells the coaching staff exactly who should be taking the tough shots at the end of the shot clock.
The Hidden Limitations of True Shooting Percentage
No single statistic tells the whole story of a basketball game. True shooting percentage is the best efficiency metric we have right now, but it still has a few blind spots that fans should understand.
The Volume Trap
Efficiency matters, but so does volume. A role player who only shoots three times a game might boast a 70% true shooting percentage. That looks amazing on paper. But you can't simply ask that player to take 20 shots and expect the same efficiency. As a player takes on a larger offensive burden, their efficiency almost always drops. Comparing the TS% of a superstar to a backup center is essentially useless.
Shot Creation vs. Catch-and-Shoot
This metric doesn't measure the difficulty of the shots taken. A point guard who has to create their own shot off the dribble with a defender in their face is doing a much harder job than a power forward catching wide-open lobs under the rim. The power forward will almost always have a higher true shooting percentage. That doesn't mean the power forward is a better overall offensive player.
The "And-One" Anomaly
We discussed the 0.44 multiplier earlier. It works perfectly over a large sample size like an 82-game season. But in a single game, it can create weird statistical quirks. If a player gets fouled on a three-point shot, makes the shot, and hits the free throw, they scored four points on zero official field goal attempts and one free throw attempt. The formula will spit out a true shooting percentage well over 100%. Over a full season, these anomalies wash out. In a one-game sample, they can skew the numbers heavily. If a player has a notoriously low free throw percentage, their true shooting rating will plummet no matter how many fouls they draw.
Frequently Asked Questions (FAQ)
What is a perfect true shooting percentage?
Mathematically, a player could achieve a true shooting percentage over 100% in a single game by hitting multiple "and-one" shots. A true perfect shooting night from the floor without taking any free throws results in a 100% TS or up to 150% if all made shots were three-pointers.
Why is true shooting percentage higher than normal field goal percentage?
It factors in the mathematical bonus of three-point shots and the high efficiency of free throws. Because professional players usually make free throws at a 75% to 85% rate, including them naturally raises a player's overall efficiency number.
Can true shooting percentage be lower than field goal percentage?
Yes. If a player shoots a high percentage on two-point field goals but shoots terribly from the free throw line and takes zero three-pointers, their TS% will often dip below their traditional field goal percentage.
Does true shooting percentage include the playoffs?
You can calculate the metric for any set of box score data. Analysts usually separate regular season TS% from playoff TS% because defensive intensity increases in the postseason, which typically causes overall efficiency numbers to drop across the board.
Who has the highest true shooting percentage in history?
Centers who exclusively shoot high-percentage dunks and layups usually dominate the all-time leaderboards. Players like Artis Gilmore, DeAndre Jordan, and Rudy Gobert hold some of the highest career marks in the sport's history.
Is TS% used in college basketball?
Yes. While it gained mainstream popularity in professional leagues, college coaches and scouts rely heavily on the metric to evaluate high school recruits and NCAA transfer portal prospects.
How do I calculate true shooting attempts?
You calculate true shooting attempts by adding a player's total field goal attempts to their total free throw attempts multiplied by 0.44. The equation is simply FGA + (0.44 * FTA).
What happens to TS% if a player misses all their free throws?
The missed free throws still count as true shooting attempts and add to the denominator of the formula. Because they generate zero points, missing free throws actively drags a player's true shooting percentage down significantly.