Coin Flip Probability Calculator
A coin flip probability calculator computes the exact mathematical odds of getting a specific count of heads or tails over multiple tosses. It evaluates fair coin tosses with equal 50% split chances alongside biased coin tests with customized weights. You can instantly figure out the likelihood of landing an exact outcome, a minimum number of hits, or an unbroken consecutive run.
Total number of times you flip the coin
Desired number of heads in the outcome
Probability for each flip (0.5 = fair coin, 0-1 range)
Choose the type of probability calculation

Created by Jose Smith
Last updated: September 20, 2026
How to Calculate Coin Flip Probability
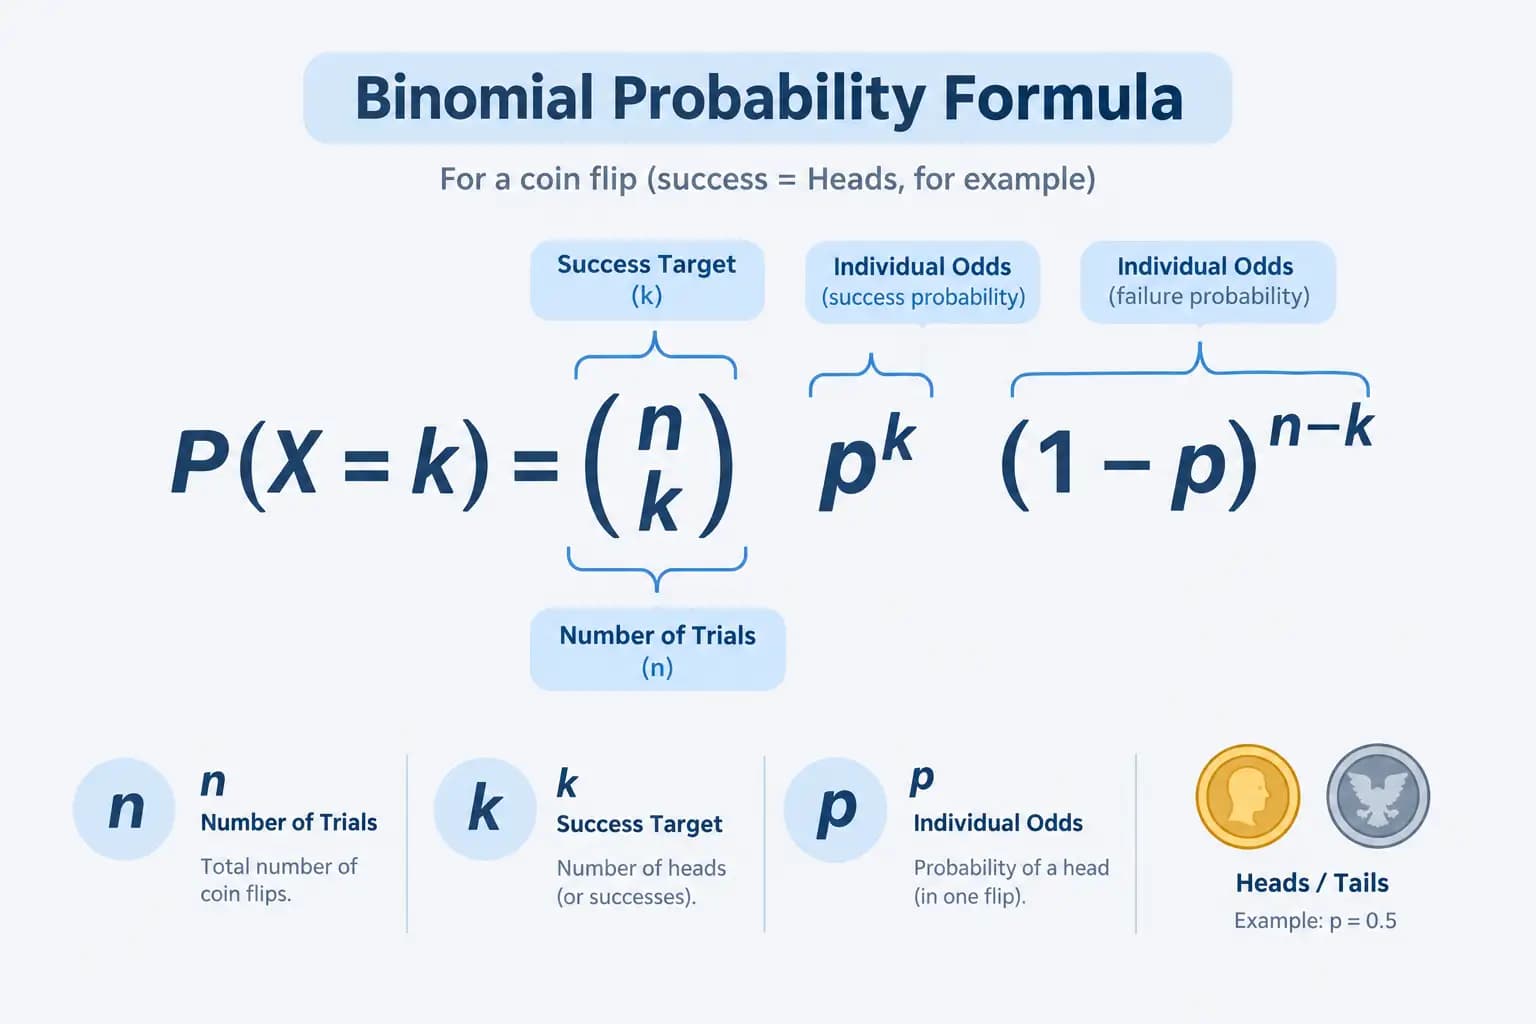
Every toss of an unweighted coin is an independent event. The coin holds no memory of past results. It does not balance itself out over three or four flips. The odds for a single event stay fixed at 0.5 (or 50%) for heads and 0.5 for tails.
When you track sequences across several flips, you apply the binomial distribution formula:
Here is what each variable represents:
- : Total number of coin tosses.
- : The target number of heads (or tails) you want to see.
- : Probability of landing on your chosen face in a single toss (0.5 for a standard coin).
- : The combinations formula, calculated as , which measures how many different ways outcomes can appear across attempts.
Suppose you toss a standard coin 5 times and want to know the chance of landing exactly 3 heads.
First, calculate the combinations:
There are 10 distinct sequences that yield 3 heads out of 5 flips (such as H-H-H-T-T, H-T-H-H-T, and so on).
Next, multiply by the individual outcome probabilities:
The probability of landing exactly 3 heads in 5 flips is 31.25%.
Single Flip vs. Cumulative Flips
A single flip gives you binary odds: 1 in 2. Once you test cumulative runs, questions shift from "What happens next?" to "What are the odds of hitting at least 7 heads out of 10 tosses?"
Cumulative probabilities aggregate individual binomial results:
- At least heads: Sum the probabilities for up to .
- At most heads: Sum the probabilities from 0 up through .
Calculating these sums manually for 50 or 100 tosses takes hours on paper. That is why software tools rely on cumulative distribution functions to yield fast, reliable outputs. If you are examining sequences with varied rates, our binomial distribution calculator walks through broader statistical distributions beyond two-sided coins.
Coin Flip Probability Table for Common Tosses
The table below breaks down the total possible outcomes, exact streaks, and benchmark probabilities for up to 10 tosses of a fair coin.
| Number of Flips (n) | Total Possible Outcomes (2n) | Chance of All Heads | Chance of Exactly Half Heads | Chance of at Least One Head |
|---|---|---|---|---|
| 1 | 2 | 50.00% | 50.00% | 50.00% |
| 2 | 4 | 25.00% | 50.00% | 75.00% |
| 3 | 8 | 12.50% | N/A (odd count) | 87.50% |
| 4 | 16 | 6.25% | 37.50% | 93.75% |
| 5 | 32 | 3.125% | N/A (odd count) | 96.88% |
| 6 | 64 | 1.563% | 31.25% | 98.44% |
| 7 | 128 | 0.781% | N/A (odd count) | 99.22% |
| 8 | 256 | 0.391% | 27.34% | 99.61% |
| 9 | 512 | 0.195% | N/A (odd count) | 99.80% |
| 10 | 1,024 | 0.098% | 24.61% | 99.90% |
Notice how the chance of getting an exact 50/50 split drops as the flip count rises. With 2 flips, hitting 1 head happens 50% of the time. With 10 flips, hitting exactly 5 heads happens only 24.61% of the time. While the distribution clusters tightly around the halfway mark, hitting the precise integer becomes less likely as the pool of potential combinations expands.
Calculating Streaks: Consecutive Heads or Tails
Streaks fascinate people because long runs look intentional. If a referee flips heads five times in a row before a football game, players call it strange. Mathematically, it is simple exponential multiplication.
The probability of flipping consecutive heads with a fair coin is:
- 3 Heads in a row: (12.5%, or 1 in 8)
- 5 Heads in a row: (3.125%, or 1 in 32)
- 10 Heads in a row: (0.098%, or roughly 1 in 1,024)
What about finding a streak somewhere inside a larger series of tosses? That calculation involves Markov chains or recursive fibonacci n-step relations rather than basic multiplication. In a set of 100 random coin flips, the probability of seeing a run of at least 6 consecutive heads is surprisingly high: roughly 54.3%. What seems like an anomaly to a human observer is normal statistical behavior across long trials.
Real-World Applications of Coin Toss Math
Coin toss modeling is not limited to party games. It provides foundational mechanics for several applied fields:
- Game Design and Balance: Game developers use simple binary trials to program critical strike rates, random loot drops, and procedural event generation. If a combat system triggers a bonus on a 50% chance, developers model coin flip formulas to verify whether players encounter game-breaking streaks.
- Finance and Risk Modeling: The binomial options pricing model breaks the movement of stock prices down into sequential intervals where the price either climbs or drops. While asset returns are more nuanced than a coin toss, basic discrete pricing relies on this identical binomial scaffold. For testing larger variance in financial forecasts, try our standard deviation calculator.
- Scientific Control Groups: Clinical researchers use randomized coin flip mechanics to assign participants to control or treatment groups. This process eliminates selection bias in blind medical trials.
- Computer Science and Algorithms: Randomized algorithms, such as randomized quicksort, use digital equivalents of coin flips to pick pivot values, avoiding worst-case sorting runtimes.
The Gambler's Fallacy: Why Past Flips Do Not Matter
Imagine flipping an unweighted coin 9 times. Every single toss lands on heads. What are the odds that the 10th toss lands on tails?
Most people answer 90% or higher. They believe the universe wants balance.
The real answer is 50%.
Believing an outcome is "due" because of past results is called the Gambler's Fallacy. A physical coin possesses no brain, no memory circuits, and no physical link to previous runs. The 10th toss operates under the exact same physics and baseline conditions as the first flip.
People confuse two distinct questions:
- "Before I start flipping, what are the odds of tossing 10 heads in a row?" The answer is tiny: 1 in 1,024 (0.098%).
- "Given that I already flipped 9 heads, what is the chance the next one is heads?" The answer is 1 in 2 (50%).
The past flips are locked in history. Their probability is now 100%. The math only weighs what is yet to happen.
The Law of Large Numbers
If past flips do not force future results to balance out, why do large samples end up near 50%?
The mechanism is dilution, not compensation. This distinction defines the Law of Large Numbers.
Suppose you start with an extreme run: 10 heads out of 10 flips. Heads sit at 100%, an excess of 10 above the expected split.
Now, flip that coin another 10,000 times. In those new flips, heads and tails land near their standard split: roughly 5,000 heads and 5,000 tails.
Add the original 10 flips back to the total:
- Total flips: 10,010
- Total heads: 5,010
- Final percentage of heads: 50.049%
The initial 10-head surplus never disappeared. It was not reversed by an equal streak of tails. Instead, it was swamped by thousands of independent trials until its relative impact shrank to background noise.
Are Real Coins Truly 50/50?
We treat coins as perfect randomizers, but real life introduces physical variables.
In 2007, researchers Persi Diaconis, Susan Holmes, and Richard Montgomery published a landmark Stanford study on coin tosses. They discovered that natural human coin flips are not strictly 50/50. Real coins exhibit a slight dynamical bias: they land on the same face that was facing up before the flip approximately 51% of the time.
The reason comes down to precession. When tossed, coins rarely spin around a single pure axis. They wobble. While wobbling, the side that started facing upward spends slightly more time oriented toward the sky during flight, tipping the landing percentage marginally in its favor.
Physical weight distributions also alter results if a coin is spun on a table rather than flipped in midair. A spun US penny lands tails up around 80% of the time because the Lincoln Memorial reverse side is marginally heavier than Lincoln's bust, pulling the coin down toward its heavier side.
Common Mistakes in Coin Flip Probability
Working through basic binomial math seems simple, but minor oversights skew results. Keep an eye out for these frequent calculation errors:
1. Confusing "At Least" with "Exactly"
Calculating the probability of getting 4 heads in 6 flips requires one specific formula value (). Calculating the probability of getting at least 4 heads requires computing the outcomes for 4, 5, and 6 heads, then adding them together. Skipping those higher values understates the real likelihood.
2. Treating Permutations as Combinations
Order matters when you write out specific step sequences, but combinations ignore order. The sequences H-H-T, H-T-H, and T-H-H are three separate permutations. However, they all map to the exact same combination: 2 heads and 1 tail. If you forget to multiply your probability by the combinations factor , your computed odds will be far too small.
3. Assuming Short-Term Samples Reflect True Probability
Flipping a coin 20 times and getting 14 tails does not mean the coin is rigged. Short sequences experience wide standard variance. You need hundreds of trials before observed results reliably approach true theoretical probabilities. To compare theoretical values with experimental sample sets, run your numbers through our z-score calculator.
Frequently Asked Questions
What is the formula for coin flip probability?
The formula is the binomial distribution: . For a fair coin, equals 0.5, where is total tosses and is the count of heads or tails.
Can a coin land on its edge?
Yes, but it is rare. An uncirculated nickel lands on its edge roughly 1 in 10,000 tosses on a flat surface. Most probability calculations round this rate to zero.
What are the odds of flipping 10 heads in a row?
The odds are , which equals , or roughly 0.098%. You would expect this sequence once every 1,024 ten-toss attempts.
Does flipping tails make heads more likely on the next turn?
No. Every coin toss is an independent event with an unvarying 50% probability for each side. The coin holds no memory of prior flips.
How many flips do I need to prove a coin is biased?
You generally need between 250 and 1,000 recorded tosses to build statistical significance. Tests like the chi-square goodness-of-fit confirm whether deviations from 50% stem from bias or random variation.
Why is getting exactly 50 heads in 100 tosses so low?
The odds are only about 7.96%. While 50 is the single most likely result, there are 101 possible outcomes (0 through 100 heads), which spreads the probability across many nearby numbers.
What is a biased coin?
A biased coin has physical defects or weights that make one outcome more probable than the other. In calculations, you adjust the value of away from 0.5 to reflect the imbalance.
Is heads or tails more common on a regular US quarter?
A midair flip lands on the starting face about 51% of the time due to aerodynamic precession. In a spinning test on a flat surface, tails lands up slightly more often because the heads side has marginally higher mass.