P-Hat Calculator
A p-hat calculator finds the sample proportion of a specific event occurring within a given sample size. You just divide the number of successful outcomes by the total number of observations. This tool helps you quickly determine both p-hat and its complement, q-hat, for statistical analysis.
Quick Examples:
Enter Your Data
Fill in the sample size and number of successes (or proportion) to calculate p̂ and confidence intervals.

Created by Jose Smith
Last updated: September 17, 2026
What Is P-hat in Statistics?
Statistics can feel overwhelming when letters start wearing little hats. The symbol p-hat looks exactly like a lowercase "p" with a caret on top. In the world of data, this symbol represents the sample proportion.
A sample proportion tells you what fraction of a specific group possesses a certain trait, made a specific choice, or experienced a specific outcome. You use this metric when you want to understand a large group but only have the time or resources to measure a small piece of it. That small piece is your sample. The result you get from measuring that sample is your p-hat.
The Difference Between P and P-hat
People often mix up the normal "p" and "p-hat" when taking a statistics class. The plain letter p stands for the population proportion. This is the true, exact percentage of an entire population that shares a trait. Finding the true population proportion is usually impossible. You would have to survey every single person on earth or test every single product a factory makes.
Because we cannot measure everything, we take a smaller sample. The proportion we calculate from that smaller sample is p-hat. It acts as an estimate for the true population proportion. As your sample size gets larger, your p-hat usually gets closer to the actual p.
How to Calculate P-hat (The Formula)
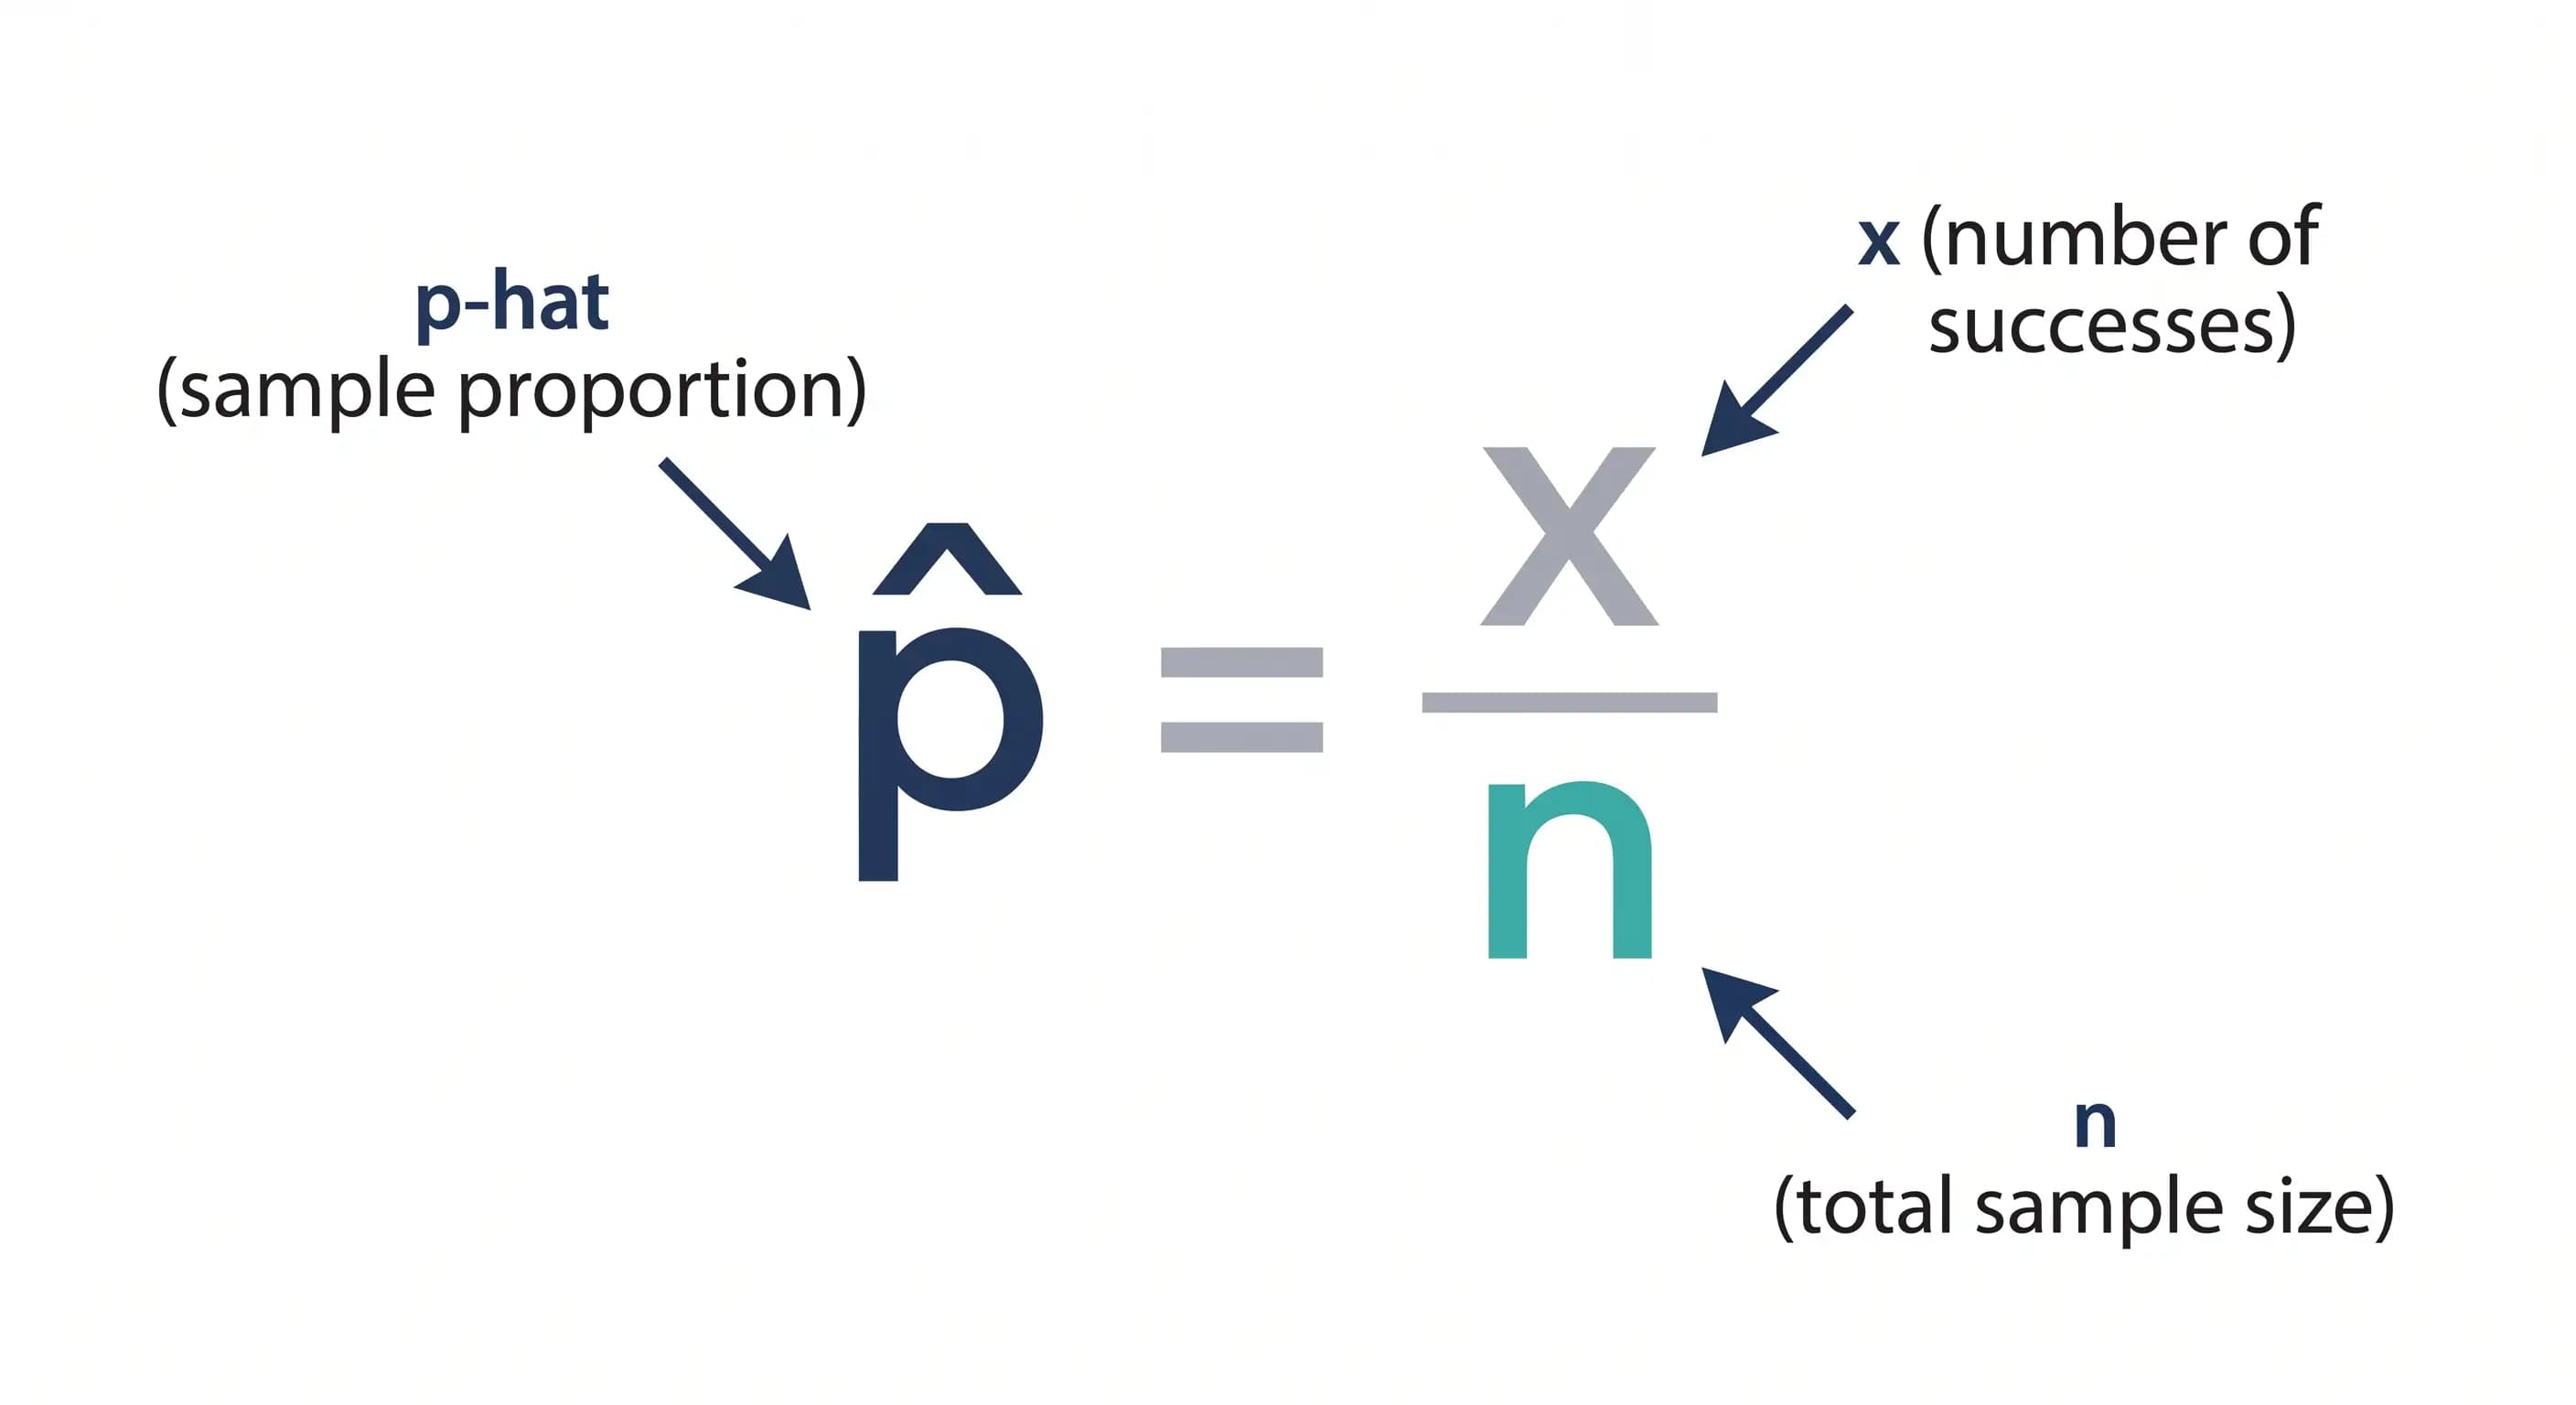
Finding your sample proportion requires a very straightforward math equation. You do not need a degree in statistics to figure it out.
The formula for p-hat is p̂ = x / n.
In this equation, the letter "x" stands for the number of occurrences or successes. A success does not always mean something good happened. It just means the specific event you are looking for actually occurred. The letter "n" represents your total sample size. This is the total number of trials you ran or the total number of items you checked.
Step-by-Step Calculation Example
Let us look at a simple scenario. Imagine you want to find out how many cars in a specific parking lot are red. You do not want to walk through the entire massive lot. You decide to check a random sample of 50 cars.
Out of those 50 cars, you count 12 red ones.
Your number of successes (x) is 12. Your sample size (n) is 50. You divide 12 by 50. Your p-hat is 0.24.
You can write this result as a decimal (0.24) or convert it to a percentage (24%). This means 24% of the cars in your sample are red.
Finding Q-hat (The Complement)
Whenever you calculate p-hat, you usually need to find its partner. This partner is called q-hat. If p-hat is the proportion of successes in your sample, q-hat is the proportion of failures.
You calculate q-hat by subtracting your p-hat from the number one. The formula is q̂ = 1 - p̂.
Looking back at the car example, our p-hat was 0.24. To find the q-hat, you subtract 0.24 from 1. This gives you 0.76. This tells you that 76% of the cars in your sample were not red. Together, p-hat and q-hat must always equal exactly 1 (or 100%). If they do not add up perfectly, you made a math error somewhere along the way.
Real-World Examples of Sample Proportions
Numbers on a whiteboard can feel abstract. Sample proportions drive decisions in almost every industry. Understanding how to use a p-hat calculation helps professionals build better products, analyze performance, and predict trends.
Sports and Athletic Performance
Athletes and coaches constantly rely on sample proportions to measure consistency. Think about tracking a basketball player shooting free throws over a ten-game stretch. The total number of shots they take is the sample size. The total number of shots they actually make is the number of occurrences. Dividing the made shots by the total attempts gives you their shooting percentage for that specific sample of games. Analysts use this exact math when projecting player stats for the rest of a season. You can easily build out a sports statistics tracker by starting with basic proportion formulas like this.
Quality Control in Construction
Construction managers and engineers use statistics to keep building sites safe. Suppose a supplier delivers a massive batch of steel bolts to a job site. Testing every single bolt for structural integrity would take weeks and ruin the materials. Instead, a supervisor pulls a random sample of 200 bolts and tests them under extreme pressure. If 4 bolts fail the stress test, the number of successes (which in this case is finding a defect) is 4. Dividing 4 by 200 gives a p-hat of 0.02. The manager now knows that roughly 2% of the entire batch might be defective.
Education and Student Assessments
Teachers use sample proportions to gauge how well a class absorbs new material. A professor might review a random sample of 30 final exams out of a lecture hall of 300 students. She wants to see how many students scored above an 85%. If 21 students in her sample hit that mark, she calculates a sample proportion of 0.70. This early metric helps her estimate the overall success rate of the entire lecture hall before grading every single paper.
Why P-hat Matters for Confidence Intervals
You rarely calculate a sample proportion just for fun. You usually calculate it as the first step in a much larger statistical process. The most common use for p-hat is building a confidence interval.
A confidence interval is a range of values that likely contains the true population proportion. Since p-hat is just an estimate based on a small group, it is never perfectly accurate. A confidence interval gives you a built-in cushion for error.
Standard Error of the Proportion
To build that cushion, you have to figure out how much your sample proportion is likely to vary from one sample to the next. This measurement is called the standard error.
Finding the standard error requires using both p-hat and q-hat. You multiply your p-hat by your q-hat. Next, you divide that product by your total sample size. Finally, you take the square root of that entire result. The standard error tells you how spread out the possible sample proportions would be if you repeated your experiment hundreds of times.
Margin of Error
Once you know the standard error, you can calculate the margin of error. You multiply the standard error by a specific z-score related to how confident you want to be. Most researchers aim for a 95% confidence level.
You take your original p-hat and add the margin of error to find the high end of your interval. Then you subtract the margin of error from your p-hat to find the low end. If you want to skip the manual algebra entirely, using a margin of error calculator will handle the heavy lifting once you know your sample proportion.
Checking Conditions for Normal Distributions
You cannot always assume your p-hat calculation gives you a reliable picture of the population. Statisticians rely on a few strict rules to make sure a sample proportion is actually useful. The most famous rule is the success-failure condition.
For your data to approximate a normal distribution, you need to expect at least 10 successes and 10 failures in your sample. You check this by multiplying your sample size by your p-hat. The result must be 10 or higher. Then you multiply your sample size by your q-hat. That result must also be 10 or higher.
If your sample is too small, or the event you are measuring is incredibly rare, your results might skew heavily in one direction. When that happens, standard confidence intervals stop working properly.
Common Mistakes When Calculating P-hat
Even though the division is simple, people make a few predictable errors when organizing their data. Avoiding these pitfalls will save you a headache on your next statistics assignment.
Confusing Sample Size with Population Size
The denominator in the formula must always be the number of items you actually observed. Sometimes students read a word problem that mentions a total population of 10,000 people, but a survey size of 500 people. They accidentally put 10,000 at the bottom of the fraction. Your "n" is always the sample size, not the population size.
Rounding Errors Too Early
Decimals get messy. It is tempting to round your p-hat to a clean two decimal places immediately. If you plan to use that p-hat to find a standard error or a confidence interval later on, early rounding will ruin your final answer. Keep at least four decimal places while doing intermediate steps. Only round down at the very end of your final calculation.
Misidentifying "Success"
In everyday language, success means winning. In statistics, success just means the event you are tracking happened. If you are tracking the percentage of packages that arrive broken, a broken package is your "success" for the sake of the formula. Flipping this logic halfway through a problem will give you q-hat instead of p-hat.
Frequently Asked Questions (FAQ)
What does p-hat mean in statistics?
P-hat represents the sample proportion. It shows the ratio of successful occurrences to the total number of trials within a specific sample group.
How do you find p-hat without x?
If you do not have the exact number of successes (x), you cannot calculate p-hat directly using the standard formula. You would need the total margin of error and standard error variables to work backward algebraically.
Can p-hat be greater than 1?
No. P-hat represents a percentage or a fraction of a whole. Since a part of a sample cannot be larger than the entire sample itself, p-hat will always be between 0 and 1.
Can p-hat be a negative number?
No. You cannot have a negative number of successes or a negative sample size. Therefore, your sample proportion can never drop below zero.
What is the difference between p-hat and p?
The symbol p represents the true proportion of an entire population. The symbol p-hat represents the estimated proportion based only on a smaller sample pulled from that population.
How is p-hat used in hypothesis testing?
Statisticians use p-hat as the test statistic when running a one-proportion z-test. They compare the sample proportion against a null hypothesis to see if the sample data provides enough evidence to reject the expected population parameter.
What is q-hat?
Q-hat is the complement of p-hat. It represents the proportion of failures in a sample, calculated by subtracting p-hat from 1.
How do you calculate the standard deviation of p-hat?
You calculate it by multiplying p by q, dividing by the sample size (n), and taking the square root of the result. When the true population p is unknown, researchers substitute p-hat to find the standard error instead.
Is p-hat a point estimate?
Yes. P-hat is a single point estimate used to guess the true population proportion.
What happens if my sample size is too small?
If your sample is too small, your p-hat might not accurately reflect the larger population. Small samples fail the success-failure condition, meaning you cannot use normal distribution models to evaluate the data safely.