IQR Calculator - Find the Interquartile Range
An IQR calculator finds the interquartile range of your data. It sorts your numbers, locates the first quartile (Q1) and third quartile (Q3), then subtracts Q1 from Q3. Paste your values and you get the IQR plus a full five-number summary right away.
12 values read
Commas, spaces, new lines or semicolons all work. Negatives and decimals are fine.
Splits at the median and leaves the median out of both halves when the count is odd.
Used by TI-83/84, most intro statistics textbooks
Five number summary
Box plot
Whiskers stop at the last value inside the fences. Dashed lines are the fences, dots are outliers.
| Value | Side | Severity | Past the fence by |
|---|---|---|---|
| 48 | above Q3 | mild | 11.75 |
With the outliers removed
| Method | Q1 | Q3 | IQR | Used by |
|---|---|---|---|---|
| 10 | 20.5 | 10.5 | TI-83/84, most intro statistics textbooks | |
| 10 | 20.5 | 10.5 | R fivenum(), Tukey's original box plot | |
| 10.5 | 19.75 | 9.25 | Excel QUARTILE.INC, NumPy, pandas | |
| 9.5 | 21.25 | 11.75 | Excel QUARTILE.EXC, Minitab, SPSS |

Created by Jose Smith
Last updated: September 20, 2026
What Is the Interquartile Range?
The interquartile range, or IQR, measures the spread of the middle half of your data. Picture your numbers sorted from smallest to largest. Chop off the bottom 25% and the top 25%. What's left in the middle is the range the IQR describes.
Because it ignores the extreme ends, the IQR gives you a clean view of where most of your values sit. One wild number won't throw it off. That's why researchers, teachers, and data analysts lean on it so often.
The IQR Formula
The formula is short and easy to remember:
IQR = Q3 - Q1
Q1 is the value at the 25th percentile. Q3 is the value at the 75th percentile. Subtract the smaller from the larger, and you have your interquartile range. If you already know both quartiles, you can find the IQR in your head.
How to Calculate IQR by Hand
You don't always need a tool. Here's the process step by step.
- Sort your data from lowest to highest.
- Find the median. That's Q2, the middle value.
- Split the data into a lower half and an upper half at the median.
- Q1 is the median of the lower half.
- Q3 is the median of the upper half.
- Subtract: IQR = Q3 - Q1.
One detail trips people up. When your dataset has an odd count, you leave the median out of both halves. When it's even, the median sits between two numbers, so each half stays whole. Let's see both.
Worked Example: Odd Number of Values
Take this set: 4, 7, 9, 11, 12, 20, 21. That's seven values, already sorted.
The middle value is 11, so Q2 = 11. Now drop it and split the rest. The lower half is 4, 7, 9, and its median is 7, so Q1 = 7. The upper half is 12, 20, 21, and its median is 20, so Q3 = 20.
IQR = 20 - 7 = 13.
Worked Example: Even Number of Values
Now try: 3, 5, 7, 8, 12, 13, 14, 18. That's eight values.
The median falls between 8 and 12, so Q2 = 10. The lower half is 3, 5, 7, 8, and its median is (5 + 7) / 2 = 6, so Q1 = 6. The upper half is 12, 13, 14, 18, and its median is (13 + 14) / 2 = 13.5, so Q3 = 13.5.
IQR = 13.5 - 6 = 7.5.
Notice how neither half borrowed the median. That keeps the math consistent. If you ever want to double-check just the middle value, a quick median calculator handles that part on its own.
The Five-Number Summary and Box Plots
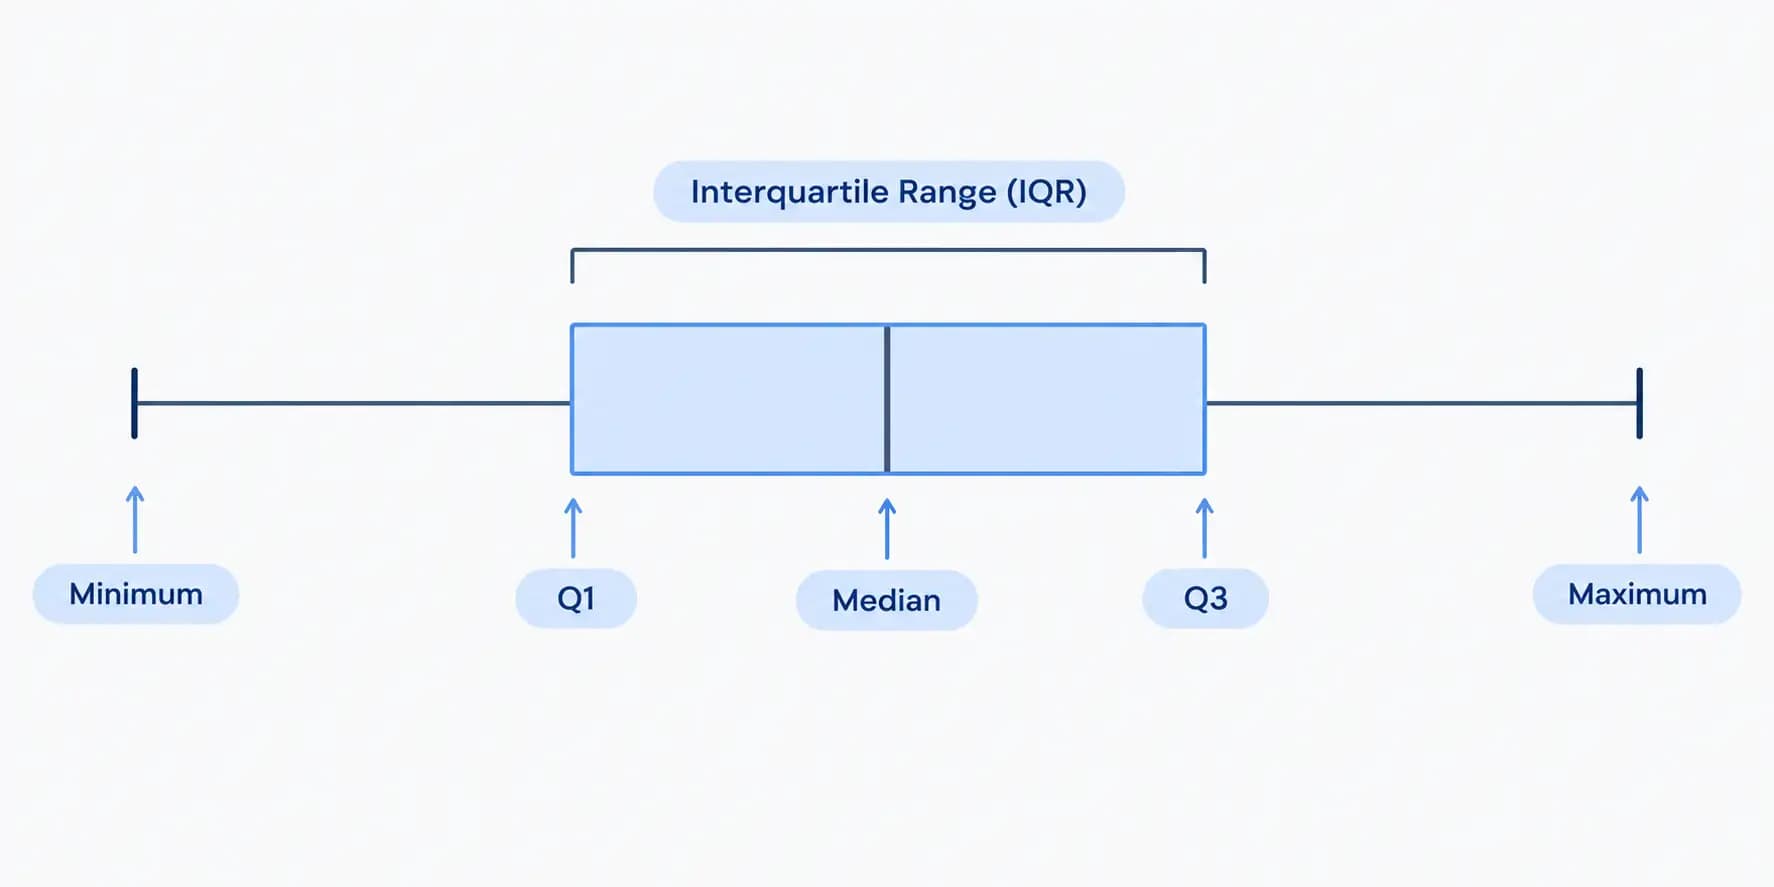
The IQR is one piece of a bigger picture called the five-number summary. Those five numbers are the minimum, Q1, the median, Q3, and the maximum. Together they describe the shape of your data in a single line.
This summary is the backbone of a box plot. The box stretches from Q1 to Q3, so its width is the IQR. A line inside marks the median, and whiskers reach out toward the smallest and largest normal values. If you want to draw one, a box plot maker turns these numbers into a chart in a couple of clicks.
Using IQR to Find Outliers
Here's where the IQR really earns its keep. It powers the most common rule for spotting outliers, the 1.5 × IQR rule.
You build two "fences" around your data:
- Lower fence = Q1 - (1.5 × IQR)
- Upper fence = Q3 + (1.5 × IQR)
Any value below the lower fence or above the upper fence counts as an outlier.
Say your data is 22, 24, 25, 26, 28, 29, 30, 31, 32, 95. Working through it, Q1 = 25, Q3 = 31, and IQR = 6. The lower fence is 25 - 9 = 16. The upper fence is 31 + 9 = 40. Every value fits between 16 and 40 except one: 95. So 95 is an outlier, and the rest of your numbers look tidy. Want to test a set quickly? An outlier calculator applies these same fences for you.
Why Use IQR Instead of Range or Standard Deviation?
Good question. The plain range only looks at the highest and lowest values, so a single freak number can blow it up. Standard deviation uses every value, which means outliers pull it in their direction too.
The IQR sits in a sweet spot. It reflects real spread but stays steady when a few values go rogue. That makes it a strong pick for skewed data, salary figures, home prices, or anything with a long tail. When your data is clean and bell-shaped, though, standard deviation still tells you more. A quick look with a standard deviation calculator is a smart second opinion when you're not sure which measure fits.
Why Do Different Calculators Give Different IQR Values?
You may notice one tool reports an IQR of 12 while another says 11.5 for the same numbers. Neither is broken. There's more than one accepted way to find quartiles.
The two you'll meet most often are the inclusive and exclusive methods. The inclusive method matches Excel's PERCENTILE.INC and R's type 7. The exclusive method matches PERCENTILE.EXC and R's type 6, and it leaves the smallest and largest points out of the interpolation. Small datasets show the biggest gaps between them.
The takeaway is simple. Pick one method, then stick with it across your whole project so your numbers stay comparable.
Real-World Examples of IQR
The IQR shows up far outside the classroom. A few quick cases:
- Test scores. A teacher checks the IQR to see how tightly the middle of the class scored, without letting one perfect paper or one zero skew the read.
- Salaries. HR teams report the IQR of pay because a couple of executive salaries would drag the average sky-high.
- Home prices. Real estate reports often quote the middle 50% of sale prices so a single mansion doesn't distort the picture.
- Response times. A support team tracks the IQR of ticket wait times to understand the typical customer, not just the one that waited three days.
In every case, the point is the same. The IQR keeps the focus on normal, everyday values.
Common Mistakes to Avoid
A few slip-ups pop up again and again:
- Forgetting to sort first. Quartiles mean nothing on unsorted data. Always order the numbers before you start.
- Mixing up IQR and range. The range spans min to max. The IQR spans Q1 to Q3. They answer different questions.
- Including the median in an odd set. Leave the median out of both halves when the count is odd.
- Switching methods midway. Using the inclusive method on one group and the exclusive method on another makes them impossible to compare.
- Reading a large IQR as "bad." A wide IQR just means your middle values are spread out. It isn't a mistake, only a description.
Frequently Asked Questions
What is a good IQR value?
There's no universal "good" number. A small IQR means your middle values are packed close together. A large one means they're spread out. What counts as good depends on your data and your goal.
Can the IQR be zero?
Yes. If Q1 and Q3 are the same value, the IQR is zero. That happens when at least the middle half of your data shares one number.
Can the IQR be negative?
No. Q3 is always greater than or equal to Q1 once data is sorted, so the IQR is never below zero.
Is IQR the same as range?
No. The range uses the smallest and largest values. The IQR uses the first and third quartiles, so it describes only the middle 50%.
What does a large IQR tell you?
It tells you the central half of your data is widely spread. Your values vary a lot even after you ignore the extremes.
Do you include the median when finding Q1 and Q3?
Only when the dataset has an even count and the median falls between two values. With an odd count, you leave the single median value out of both halves.
Is the IQR affected by outliers?
Barely. That's its main strength. Extreme values live outside the middle 50%, so they don't move the IQR much.
What is the 1.5 IQR rule?
It's the standard test for outliers. Any value below Q1 - 1.5 × IQR or above Q3 + 1.5 × IQR is flagged as an outlier.