Quartile Calculator
A quartile calculator takes a list of numbers and splits it into four equal parts. It shows you the first quartile (Q1), the second quartile (Q2, which is the median), and the third quartile (Q3), along with the interquartile range and your smallest and largest values. Paste your data and read the results.
| Method | Q1 | Q2 | Q3 | IQR |
|---|---|---|---|---|
| Exclusive | 20.0000 | 29.5000 | 42.5000 | 22.5000 |
| Inclusive | 20.0000 | 29.5000 | 42.5000 | 22.5000 |
| Excel/TI-84 | 19.0000 | 29.5000 | 43.7500 | 24.7500 |
* Different methods may produce slightly different results, especially for small datasets.

Created by Jose Smith
Last updated: September 20, 2026
What Is a Quartile?
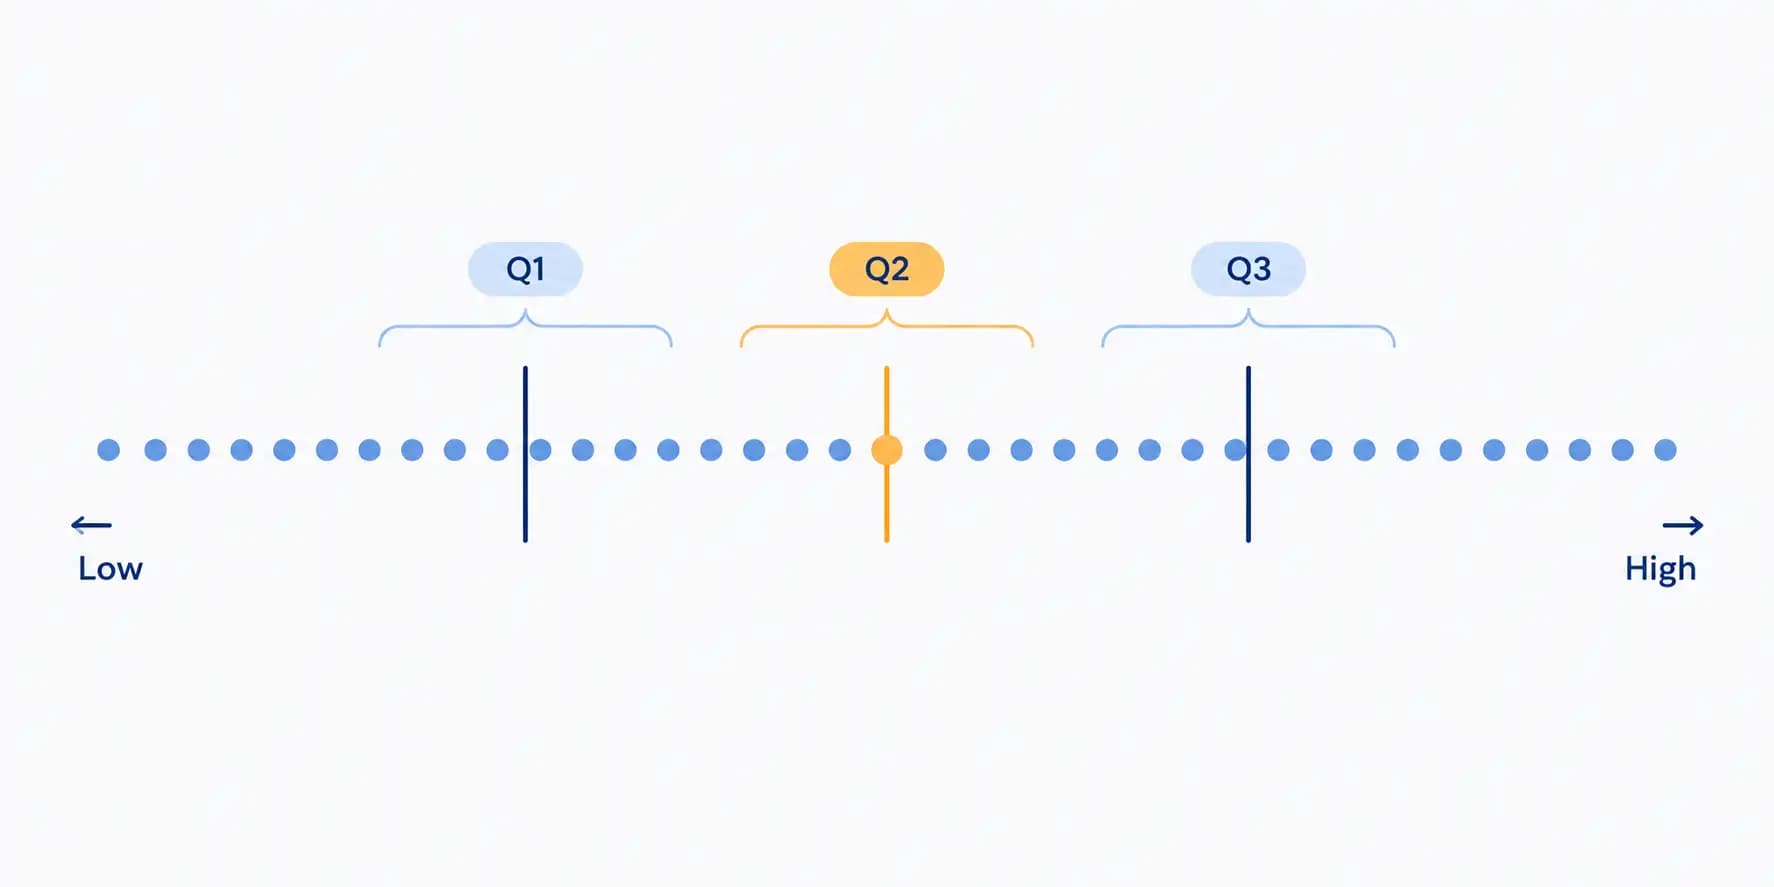
A quartile is a value that cuts your sorted data into quarters. Picture lining up every number from smallest to largest, then slicing that line into four groups of equal size. The three cut points are your quartiles.
Here's what each one means:
- Q1, the first quartile, sits at the 25th percentile. A quarter of your values fall below it.
- Q2, the second quartile, sits at the 50th percentile. This is the median, the middle of your data.
- Q3, the third quartile, sits at the 75th percentile. Three quarters of your values fall below it.
So Q2 splits the data in half. Q1 splits the lower half, and Q3 splits the upper half. Together they tell you how spread out your numbers are, not just where the center sits. If you only need the middle value on its own, a median calculator handles that single step.
What This Calculator Gives You
Enter your data once, and the tool returns more than the three quartiles. You get the full five-number summary, which is the backbone of most quick data checks.
- Minimum: the smallest value.
- Q1: the lower quartile.
- Q2: the median.
- Q3: the upper quartile.
- Maximum: the largest value.
It also shows the interquartile range (IQR) and the total range. The range is simply the maximum minus the minimum. The IQR focuses on the middle half of your data, which makes it far less sensitive to one odd value sitting at either end.
How to Calculate Quartiles by Hand
You don't need the tool to understand what it's doing. The steps are short, and working through one by hand makes the output click.
- Sort your data from lowest to highest.
- Find the median. That's Q2.
- Split the data at the median into a lower half and an upper half.
- Q1 is the median of the lower half.
- Q3 is the median of the upper half.
One choice decides a lot. When your data has an odd count, do you include the middle value in each half, or leave it out? Different rules answer that differently, and that's why two tools can disagree. More on that in a moment. First, two quick examples.
Example with an Odd Number of Values
Say your data is 4, 8, 15, 16, 23, 42, 108. That's seven values, already sorted.
The median is the 4th value, 16. So Q2 = 16.
The lower half is 4, 8, 15. Its median is 8, so Q1 = 8. The upper half is 23, 42, 108. Its median is 42, so Q3 = 42.
Notice we left the median (16) out of both halves. That's the common textbook approach.
Example with an Even Number of Values
Now take 2, 4, 5, 7, 8, 10, 12, 14. There are eight values.
With an even count, there's no single middle number. The median is the average of the two middle values, the 4th and 5th: (7 + 8) / 2 = 7.5. So Q2 = 7.5.
Here the halves split cleanly. The lower half is 2, 4, 5, 7, and its median is (4 + 5) / 2 = 4.5, so Q1 = 4.5. The upper half is 8, 10, 12, 14, and its median is (10 + 12) / 2 = 11, so Q3 = 11.
That gives an IQR of 11 minus 4.5, which is 6.5.
Why Two Calculators Can Give Different Quartiles
Ever run the same numbers through two quartile tools and get two different answers? You're not doing anything wrong. There isn't one official way to find quartiles. There are several, and they treat the median differently.
Here are the ones you'll run into most:
- Exclusive method (Tukey / Moore and McCabe): when the count is odd, the median is left out of both halves. Many textbooks teach this, and it matches Excel's
QUARTILE.EXC. - Inclusive method: the median is kept in each half before finding Q1 and Q3. Excel's
QUARTILE.INCand the olderQUARTILEfunction use a version of this, built on linear interpolation. - Linear interpolation methods: instead of picking an actual data point, these estimate the quartile position with a formula like (n + 1) / 4, then interpolate between the two nearest values.
For large datasets, the methods land close together. For small ones, they can differ by a noticeable amount. The takeaway is simple: pick one method and stick with it whenever you compare groups. A good calculator tells you which method it's using, so your results line up with your class, your software, or your report.
How to Find the Interquartile Range (IQR)
The interquartile range measures the spread of the middle 50% of your data. The formula is short:
IQR = Q3 - Q1
Using the even example above, IQR = 11 - 4.5 = 6.5. A small IQR means the middle values are packed tight. A large one means they're spread out.
The IQR really earns its keep in outlier detection. A common rule flags any value that sits more than 1.5 times the IQR below Q1 or above Q3. Those cutoff points are the lower and upper fences:
- Lower fence = Q1 - (1.5 × IQR)
- Upper fence = Q3 + (1.5 × IQR)
Anything past those fences is worth a second look. If you work with the middle spread a lot, a dedicated IQR calculator saves you the extra subtraction.
Where Quartiles Show Up in Real Life
Quartiles aren't just a classroom drill. They quietly power a lot of everyday numbers.
- Test scores: a school might say you scored in the top quartile, meaning above 75% of your peers.
- Salaries: job sites often list pay as a band from the 25th to the 75th percentile, which is exactly Q1 to Q3.
- Home prices: real estate reports lean on quartiles to describe a market without letting one mansion skew the story.
- Health charts: a child's height or weight percentile compares them against a large reference group.
- Box plots: the box in a box-and-whisker plot runs from Q1 to Q3, with a line drawn at the median.
That last one is why quartiles and box plots go together. The five-number summary is basically a box plot written as a list. If you'd rather see it as a picture, a box plot maker turns the same five numbers into a chart.
Common Mistakes to Avoid
A few small slips trip people up more than the math itself.
- Forgetting to sort. Quartiles only make sense on ordered data. The calculator sorts for you, but by hand this is the number one error.
- Mixing methods. Getting Q1 with one rule and Q3 with another gives a summary that doesn't hold together.
- Confusing quartiles with quarters of the range. A quartile is about how many values fall below it, not about chopping the min-to-max distance into four equal pieces.
- Reading Q2 as the average. Q2 is the median, the middle value. The mean can be very different, especially when outliers are present.
- Using too little data. With only three or four numbers, quartiles wobble and are easy to misread.
Frequently Asked Questions
What are Q1, Q2, and Q3?
Q1 is the 25th percentile, Q2 is the median (50th percentile), and Q3 is the 75th percentile. Together they split sorted data into four equal parts.
Is the second quartile the same as the median?
Yes. Q2 and the median are the same value. Both mark the middle of your sorted data.
How many numbers do I need to calculate quartiles?
Aim for at least four values for a result you can trust. The math runs with fewer, but small samples give shaky quartiles.
Why do Excel and my calculator give different quartiles?
They likely use different methods. QUARTILE.INC and QUARTILE.EXC handle the median differently, so their answers can split on small datasets.
Do I need to sort my data first?
Not with this tool. It sorts automatically. If you calculate by hand, you must order the numbers from lowest to highest before anything else.
What is the interquartile range used for?
It measures the spread of the middle half of your data and helps flag outliers using the 1.5 × IQR rule.
Can quartiles handle repeated or negative numbers?
Yes. Duplicates and negatives count like any other value. Sort them in order, and the method still works.
What's the difference between a quartile and a percentile?
A percentile splits data into 100 parts, and a quartile splits it into 4. Q1, Q2, and Q3 equal the 25th, 50th, and 75th percentiles.